

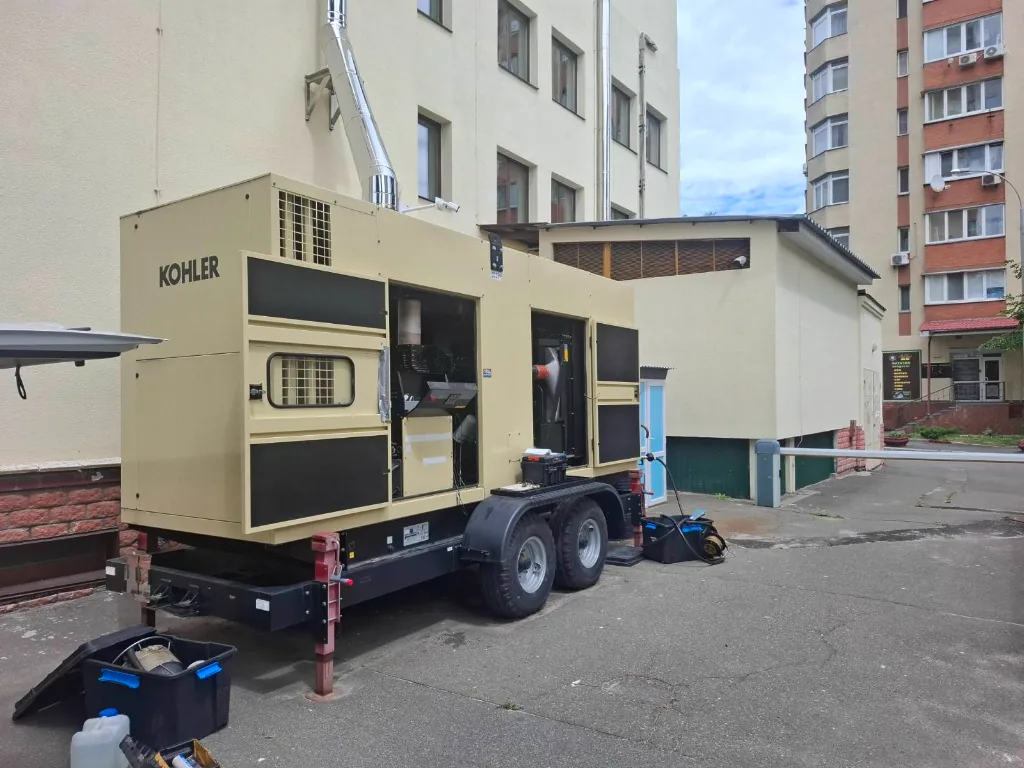
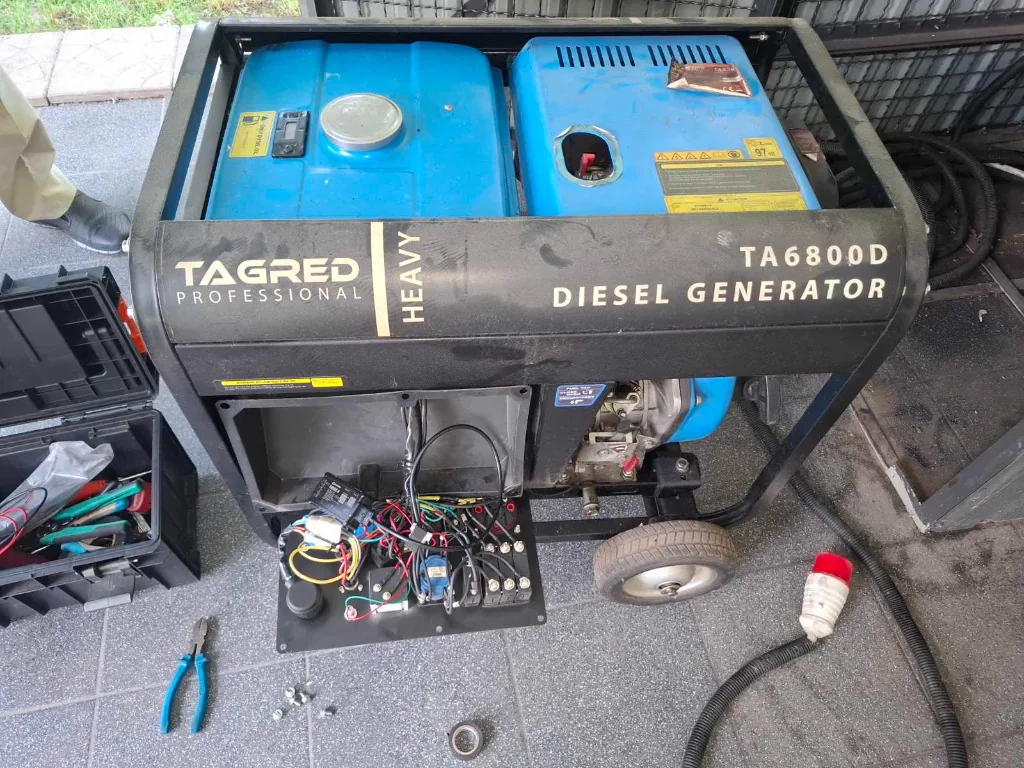
The customer's task
The customer came to us wanting firm control over industrial and standby diesel generators. The main needs: make fuel drains impossible, automate the accounting of hours actually worked, and get accurate data on the technical condition and fuel use.
The solution
The solution is built around a Teltonika FMB125 tracker. We pick the source of fuel data based on two things: what the unit itself can report, and the geometry of the fuel tank.
What CAN is, in plain words. Modern machinery has its own on-board computer, and the CAN bus is the internal "nervous system" its control units use to exchange data: how much fuel is in the tank, engine RPM, temperature, hours worked. If a generator has such a bus, the tracker simply reads the ready figures from its own electronics — nothing needs to be drilled or cut into the tank. A fuel level sensor is a physical probe lowered into the tank that measures the level directly. It is accurate regardless of what the on-board computer can do, but it does require cutting into the tank.
- A generator stands still — and that decides everything. This is exactly why CAN can be calibrated properly here: the fuel does not slosh in the tank and the bus readings are stable. If the unit reports the fuel level over CAN we take the data from there, and no fuel level sensor is needed. Our engineers decode the bus readings and convert them into real litres.
- We fit a fuel level sensor when fuel cannot be read from CAN. The sensor is cut into the tank and calibrated against actual volumes, so it too counts litres rather than percentages. On the object in the reports below, fuel accounting runs on the sensor.
- In either case the FMB125 is wired to the ignition circuit — that is where engine hours come from: only the time the engine actually runs is counted.
On moving equipment it is the other way round. There, CAN fuel data is imprecise, and that is physics rather than configuration: blind zones at the bottom and top of the tank, the coarse resolution of the factory sensor, and fuel movement while driving, which a modern fuel level sensor smooths out. So on cars and trucks the level is taken from a sensor, and CAN is added separately — for RPM, engine and coolant temperature, AdBlue level, the factory fuel counter and error codes.
What the customer got
- Every refuelling with its exact volume: the system logs the time, the place and the number of litres added. The level before and after is visible, so the fuel added can be checked against the receipt.
- Drains are visible immediately: any sharp drop in level not related to engine operation is logged as a drain with the time and place. The alert arrives via Telegram, SMS or push.
- Average consumption per engine hour: the key metric for a generator. The system calculates litres per hour for each run, so a deviation from the norm stands out at once — an early sign of either a fault or abuse.
- Honest engine hours: accounting follows the actual running time of the engine rather than logbook entries. Scheduled maintenance is tied to real usage.
- Location control: for mobile and rented units it is clear exactly where the generator was working and whether it was moved without approval.
- Ready-made reports: daily summaries, the list of engine runs and the refuelling log are generated automatically — no manual spreadsheets.
This solution lets a business take full control of fuel spending during power outages, and it pays for itself within the first months of use.
What it looks like in the reports
Below is real data from the monitoring system for one of the generators, 1–2 May 2026. The object name and address are hidden at the customer's request; the figures are unchanged.
Daily summary for 1 May
| Engine hours | 4:19:00 |
|---|---|
| Fuel level at start | 176.33 l |
| Fuel level at end | 171.88 l |
| Consumed (sensor) | 31.05 l |
| Average consumption | 7.07 l/h |
| Total fuel drained | 0.00 l |
| Number of drains | 0 |
| Total refuelled | 26.59 l |
| Number of refuellings | 1 |
Engine runs
| # | Start | End | Engine hours | Consumed | Average |
|---|---|---|---|---|---|
| 1 | 01.05.2026 14:31:57 | 01.05.2026 18:50:57 | 4:19:00 | 30.51 l | 7.07 l/h |
| 2 | 02.05.2026 06:25:01 | 02.05.2026 17:27:26 | 11:02:25 | 65.40 l | 5.92 l/h |
Note the pattern: on the second day the engine ran for 11 hours straight at an average of 5.92 l/h — noticeably lower than the 7.07 l/h of the short four-hour run. Engine-hour accounting is what makes such deviations visible; without it both days would simply read as "fuel was added".
Refuelling log
| Time | Level before | Added | Level after |
|---|---|---|---|
| 01.05.2026 18:42:34 | 157.32 l | 26.59 l | 183.92 l |
| 02.05.2026 15:07:10 | 131.79 l | 51.54 l | 183.32 l |
Every refuelling has an exact time and volume, so it can be checked against the receipt from the filling station. Across both days the system recorded zero drains — which is a result in itself, because it confirms the fuel is being used as intended.
More about the service: Non-standard GPS solutions